|
|
| (15 intermediate revisions by the same user not shown) |
| Line 1: |
Line 1: |
| − | =Brief philosophical notes from Luisa= | + | =The cloud= |
| − | ==Real science vs. textbook science==
| |
| − | *Science (history) as presented in textbooks may seem a never-ending series of right answers. Real science has a lot of dead ends as we struggle to find out what the ‘right answer’ is.
| |
| − | *Science problems in textbooks have well-defined problems, specific methods you’re supposed to use to solve them, and right (exact) answers (1.2 can be wrong when 1.3 is right). Real science is not quite “made up as you go along” but it may feel that way in the coming days. Different people approach the same problem in different ways, and many answers can be right (1.2 and 1.3 can both be right). '''The only way you know it’s the right answer is if you believe that everything you did to get there is right.'''
| |
| | | | |
| − | ==Why should anyone care about young stars?==
| + | [[Image:ic2118iras.jpg|right]]IC 2118, the Witch Head Nebula is a small cloud near the supergiant star Rigel in the constellation Orion. In the image at the right (taken by IRAS at 25 microns), IC 2118 is the structure at the bottom right corner. Rigel appears to be at least partially responsible for exciting and blowing off a significant portion of the nebula in this region. This cloud is about 210 parsecs away, similar in distance to the Orion Nebula Cluster (a.k.a. the ONC, or the sword of Orion). The ONC is a cluster of stars that are so bright that they too may be pushing around the gas and dust in the Witch Head Nebula. The ONC is sort of the "downtown", the "urban" area of star formation - lots of stars close together, lots of things going on all the time. There are so many stars here, so close together, that if we lived there, there would never be night. There are a ''lot'' of stars in the ONC!! Our cloud, the Witch Head Nebula, is sort of the "country." There are some things going on here, not a whole lot (especially in comparison to the ONC), but still interesting. |
| − | *Understanding star formation includes understanding how planets form, including planets like Earth.
| |
| − | *Star formation is the "happening field" right now! TONS of new discoveries happening all the time, many driven by Spitzer.
| |
| − | *A friend who is the author of a popular college textbook told me that the chapter that she revises most frequently (particularly recently) in response to new developments is the star formation chapter.
| |
| − | *By doing this project, you are participating in the revolution!
| |
| | | | |
| − | =Young stars in general: Introduction to (low-mass) star formation=
| + | What we are trying to do is characterize the process of pre-main sequence stellar evolution in this cluster. We want to (a) find the young stars, and (b) compare star formation in this cluster with others from different environments (such as the much denser ONC) to see if there are similarities or differences. |
| − | ==Overview==
| |
| − | {| cellpadding="1"
| |
| − | | [[Image:starformationcartoon.png]]
| |
| − | |''Cartoon from Greene, American Scientist, Jul-Aug 2001''
| |
| − | |}
| |
| | | | |
| − | Stars begin their life in a cloud of gas and dust (a nebula). Gravitational forces cause the nebula to start to condense (shrink). (a, b)
| + | Previous all-sky surveys, including both IRAS and 2MASS, have included this region, but not to the resolution or the wavelengths that Spitzer can provide, and there are few studies of this particular region in the literature. |
| | | | |
| − | As the nebula shrinks, like a spinning skater pulling in her arms, it begins to spin more rapidly. The same physics ("conservation of angular momentum") means that the dust and gas in the nebula doesn't fall straight into the center; it falls onto a disk surrounding the central object, and from the disk, the matter falls onto the central object. The temperature at the center of the shrinking nebula rises due to increasing pressure and friction between the particles. The figure has this stage labeled as a "protostar", but for some astronomers, beginning at this stage, and until the star starts to turn H into He the object is still called a protostar. Since the protostar is still embedded in a thick cloud of gas and dust, it can only be detected in the infrared. (c)
| + | ''Need to continue here with more information on a literature review'' |
| | | | |
| − | When the protostar enters the next stage, labeled in the figure as the T Tauri stage, it’s still gaining mass and contracting slowly because material is still falling onto it, but it begins to eject gas in two giant gas jets, called bipolar flows. These jets and stellar winds eventually sweep away the envelope of gas still surrounding the protostar. In the surrounding disk protoplanets are beginning to form. (d)
| + | =The observations= |
| | | | |
| − | Leftover material in the disk surrounding the star clumps together and undergoes many collisions until most of the material has been swept up by objects orbiting the star, such as planets, asteroids and comets. (e)
| + | In our first observation of this region, we selected for observation by IRAC and MIPS a target area based on the IRAS survey and recent work conducted by Kun et al. (2004). Our Spitzer time was limited so we selected an area of the cloud near the "head" of the nebula that had a known IRAS source and 3 possible new classical T Tauri stars that were identified by Kun et al. In our second observation of this region, we were granted 11.5 hrs to go as far down the cloud as we could. We were able to go about 2.5 degrees down the cloud with both IRAC and MIPS. |
| | | | |
| − | The star’s life so far has been governed by the continuous inward pressure of gravity. The gravitational pressure keeps compressing the gas into a smaller and smaller volume, making it hotter and hotter in the core. As soon as the temperature in the core of the protostar becomes great enough, nuclear fusion begins. When this nuclear fusion begins, finally the star has a way to "fight back" against gravity. So much energy is released in this reaction that it enables the star to "push back" with an outward radiation pressure that balances the inward push of gravity. The protostar is now a full-fledged star, fusing hydrogen into helium in its core. (f) The star will stay the same size until it runs out of nuclear fuel in the core (all of the hydrogen has been converted into helium). Then, the pressure from gravity takes over again, pushing in on the star.
| + | [[Image:Ic2118_coverage.png]] |
| | | | |
| − | ==More in depth, and SEDs==
| + | On the left, previous objects in this region are indicated on top of a grayscale image in IRAS-25 (25 microns). In the center, the first year's coverage using IRAC is indicated. On the right, you can see the second year's coverage using IRAC (cyan and magenta) and MIPS (pink, blue, and green). |
| − | Now, the cartoon above is the version of this information that is appropriate for an "educated person from the general public." Now, let's look at this same story again, but using the kinds of plots and information used by professional astronomers.
| |
| | | | |
| − | A spectral energy distribution (SED) is a graph of the energy emitted by a star as a function of different wavelengths. There are some example SEDs below. Astronomers originally used the slope of the SEDs for protostars between about 2 and 20 microns quite literally to '''define''' different classes. (This is similar to the process that astronomers such as [http://en.wikipedia.org/wiki/Annie_Jump_Cannon Annie Jump Cannon] followed when they originally classified stars -- astronomers start by putting similar objects together, and through this process, eventually deeper physical understanding follows.) These stages that were defined based on the SED slope are dubbed Class I, II, and III. As we learned more, we created another class called "flat" between Class I and II. The very earliest stages, ones where there are no 2 micron observations at all, are the Class 0s. These classifications more or less match up to the overall sequence of events described by the cartoon above.
| + | The observations we have cover a ''very'' large area. For comparison, the full moon is about half a degree across. Our mosaics are 2.5 degrees long, so 5 full moons long. Because these mosaics are so large, it takes a lot of computing power to create them. Luisa created our mosaics using a high-powered linux machine. It took about 45 hours to generate the IRAC mosaics, about 9 hours to generate the MIPS-1 (24 micron) mosaic, and about 3 hours to generate the MIPS-2 (70 micron) mosaics. |
| | | | |
| − | {| cellpadding="2"
| + | =Examining the mosaics= |
| − | | [[Image:class0.png]]
| |
| − | | This SED corresponds to the earliest, most embedded phase, called Class 0. The x-axis is wavelength, and the y-axis is energy. It looks like a cold black body; all of the emission comes from the dust and gas in the cloud. The mass of the envelope surrounding the star is more than half a solar mass. The age of the object is about 10,000 (<math>10^4</math>) years. This is thoguht to be the main accretion phase, where most of the mass of the object is accreted from the cloud.
| |
| − | |}
| |
| | | | |
| − | {| cellpadding="2"
| + | to come. include warning that You may need to have a lot of RAM in your computer if you want to load in 3 or 4 of our mosaics all at the same time. |
| − | | [[Image:classI.png]]
| |
| − | |This Class I SED is the next stage. See how now there is a warmer blackbody corresponding to the central object, but most of the energy is coming from the dusty cocoon around the star. The "bite" that is at about 10 microns tells us that there are silicates (beach sand) in the dust around the star. About this time is when the rate of accretion slows. The envelope is now about 0.1 Msun. The age of the object is about <math>10^5</math> years.
| |
| − | |}
| |
| | | | |
| − | {| cellpadding="2"
| + | =A first look at the catalog with color-color plots= |
| − | | [[Image:classII.png]]
| + | this discussion will center on using color-color plots with the catalog. Need to emphasize here (and earlier) that many of the tools and techniques developed for IC 2118 will work in any other star-forming region observed with Spitzer. |
| − | |This Class II SED is also a kind of object also known as a young T Tauri ("Classical T Tauri"). Most of the energy is coming from the central object (warm blackbody), but there is a little emission from the disk; the disk is optically thick. The disk mass now is very roughly 0.01 Msun. The age of the object is about <math>10^6</math> years. Several of the objects in IC 2118 look like this.
| |
| − | |}
| |
| | | | |
| − | {| cellpadding="2"
| + | =Examining special sources more in depth using SEDs= |
| − | | [[Image:classIII.png]]
| |
| − | |This SED is of the last stage, Class III; this is an older T Tauri ("Weak-Lined T Tauri"). The protostar still has a little dust left around it. The disk now is optically thin. The disk mass is very roughly 0.003 Msun. The object is about <math>10^7</math> years old.
| |
| − | Several of the objects in IC2118 look like this.
| |
| − | |}
| |
| − | | |
| − | ==Several important notes about this classification scheme==
| |
| − | *As the ages mentioned above suggest, this sequence of Class 0 to I to II to III is often interpreted as an age sequence, so a Class I object is younger than a Class II object, etc. Some of the most recent evidence suggests that maybe the connection to age is not as secure as we have been thinking! So let me just reiterate: the Class of each object is ''defined'' by the slope of the SED. The physical interpretation of the classification definition is degree of embeddedness, e.g., Class 0s are still buried deep within their natal cloud, and Class IIIs have freed themselves. '''The interpretation of the Class as an age may change.'''
| |
| − | *This process strictly only applies to low-mass stars. High-mass stars might very well do this, only faster. We just don’t know yet for sure.
| |
| − | *Class 0s are the the hardest to "catch in the act", from which we infer that they are the shortest lived. Not too long ago, the list of all of the Class 0s known could fit on one page. Spitzer is changing that. Class Is are also being found by Spitzer in abundance.
| |
| − | *Class 0s used to be defined as "undetectable in IR." Even before Spitzer, deeper integrations forced a change in that definition.
| |
| − | *Although the story seems nice and well-defined, even before Spitzer, Class IIs and IIIs have been found at the same ages, e.g., some stars lose their disks very quickly, and some hold on to them for a long time. Now with Spitzer, we're muddying the waters even more.
| |
| − | *A current major question in star formation is the how and why of this process.
| |
| − | *It’s not clear whether Class 0s and Is are found at the same age – until very recently, too few of them were known, and getting an age for them is tough.
| |
| − | *[http://www.spitzer.caltech.edu/Media/releases/ssc2004-17/release.shtml This press release] talks about A stars, which are a little massive for Class 0/I/II/III, but the confusion in disk clearing timescales is vividly displayed there.
| |
| − | *We can be fooled! You can imagine that a Class III that is edge-on might look like a Class II. It could be that some things we think are the youngest protostars are actually just edge-on older things. This is also one of the current burning questions.
| |
| − | *Most people still use the series Class 0-I-II-III to mean a series of youngest to oldest, but it’s important to remember all of these uncertainties.
| |
| − | | |
| − | The details of the shape of the SED can tell us about the disk structure. Dips and wiggles in the SED may suggest, e.g., that there is no (or little) dust near the star, just further out.
| |
| − | | |
| − | =Young stars in general: Finding the cluster members=
| |
| − | | |
| − | Spitzer is so sensitive that it easily sees things at the far reaches of the Universe with only a few seconds' integration. When studying clusters of stars, not just with Spitzer, one of the first major goals is to figure out which objects are truly cluster members and which are not. [[Media:findingclustermembers.pdf| This pdf file]] has a discussion of how to find members of young clusters in general.
| |
| − | | |
| − | =Working specifically with IC 2118=
| |
| − | Many of the tools and techniques developed for IC 2118 will work in any other star-forming region observed with Spitzer. Here are some things pertaining specifically to the IC 2118 region.
| |
| − | ''(to come when i have time!)''
| |
The cloud
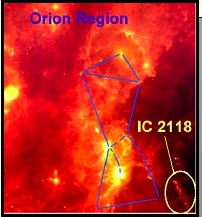
IC 2118, the Witch Head Nebula is a small cloud near the supergiant star Rigel in the constellation Orion. In the image at the right (taken by IRAS at 25 microns), IC 2118 is the structure at the bottom right corner. Rigel appears to be at least partially responsible for exciting and blowing off a significant portion of the nebula in this region. This cloud is about 210 parsecs away, similar in distance to the Orion Nebula Cluster (a.k.a. the ONC, or the sword of Orion). The ONC is a cluster of stars that are so bright that they too may be pushing around the gas and dust in the Witch Head Nebula. The ONC is sort of the "downtown", the "urban" area of star formation - lots of stars close together, lots of things going on all the time. There are so many stars here, so close together, that if we lived there, there would never be night. There are a lot of stars in the ONC!! Our cloud, the Witch Head Nebula, is sort of the "country." There are some things going on here, not a whole lot (especially in comparison to the ONC), but still interesting.
What we are trying to do is characterize the process of pre-main sequence stellar evolution in this cluster. We want to (a) find the young stars, and (b) compare star formation in this cluster with others from different environments (such as the much denser ONC) to see if there are similarities or differences.
Previous all-sky surveys, including both IRAS and 2MASS, have included this region, but not to the resolution or the wavelengths that Spitzer can provide, and there are few studies of this particular region in the literature.
Need to continue here with more information on a literature review
The observations
In our first observation of this region, we selected for observation by IRAC and MIPS a target area based on the IRAS survey and recent work conducted by Kun et al. (2004). Our Spitzer time was limited so we selected an area of the cloud near the "head" of the nebula that had a known IRAS source and 3 possible new classical T Tauri stars that were identified by Kun et al. In our second observation of this region, we were granted 11.5 hrs to go as far down the cloud as we could. We were able to go about 2.5 degrees down the cloud with both IRAC and MIPS.
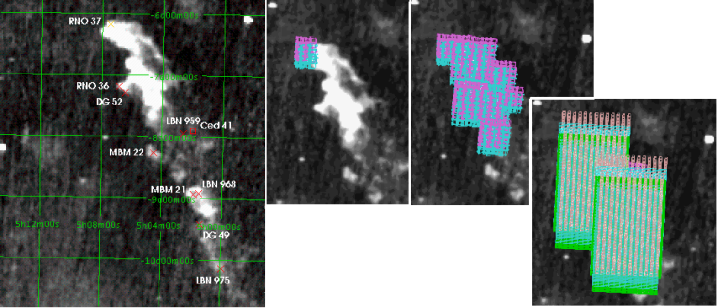
On the left, previous objects in this region are indicated on top of a grayscale image in IRAS-25 (25 microns). In the center, the first year's coverage using IRAC is indicated. On the right, you can see the second year's coverage using IRAC (cyan and magenta) and MIPS (pink, blue, and green).
The observations we have cover a very large area. For comparison, the full moon is about half a degree across. Our mosaics are 2.5 degrees long, so 5 full moons long. Because these mosaics are so large, it takes a lot of computing power to create them. Luisa created our mosaics using a high-powered linux machine. It took about 45 hours to generate the IRAC mosaics, about 9 hours to generate the MIPS-1 (24 micron) mosaic, and about 3 hours to generate the MIPS-2 (70 micron) mosaics.
Examining the mosaics
to come. include warning that You may need to have a lot of RAM in your computer if you want to load in 3 or 4 of our mosaics all at the same time.
A first look at the catalog with color-color plots
this discussion will center on using color-color plots with the catalog. Need to emphasize here (and earlier) that many of the tools and techniques developed for IC 2118 will work in any other star-forming region observed with Spitzer.
Examining special sources more in depth using SEDs

